This article is specific Knowledge Assessments analytics. We’ve rebuilt our analytics module to make it easier to access the information you need.
-
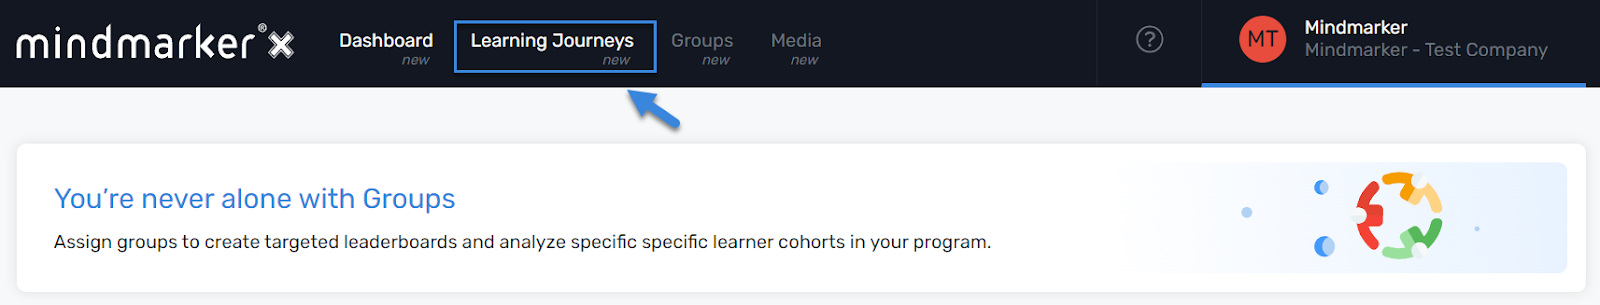
Navigate to your Learning Journeys menu
-
Click Learning Journeys from your menu bar
-
-
Select a Knowledge Assessment
-
From the list of programs, select the Knowledge Assessment you wish to analyze.
-
-
Select Program Analytics
- Click on Program Analytics. The analytics module will open directly to the Summary tab.
- Click on Program Analytics. The analytics module will open directly to the Summary tab.
-
Summary Tab
-
The Summary tab is designed to provide a quick overview of assessment results and has 4 sections:
- Participation: Overview of participant status.
- Knowledge Assessment Score: Overview of overall Assessment performance highlighting (up to) the 5 lowest scoring questions on the assessment.
- Objectives: Provides an average score (points earned/points possible) for each learning objective associated with questions in the assessment.
- Leaderboard (if enabled): Overview of the 5 highest and 5 lowest scoring participants
-
-
Participation Tab
- The Participation tab provides an overview of participant status, and highlights individual mindmarker completion rate to help you identify where learners may be struggling.
- In addition to providing an overview of all learners’ status, a table of all individual results is made available. This table can be searched, sorted, filtered and exported to support your specific needs.
- The Participation tab provides an overview of participant status, and highlights individual mindmarker completion rate to help you identify where learners may be struggling.
-
Responses Tab
-
Participant answers to all questions in the Knowledge Assessment can be reviewed and analyzed in the Responses tab. Within Responses, there is a sub-tab for each mindmarker type available in a Knowledge Assessment: Knowledge Check and Open Response.
From the drop-down list available in both sub-tabs, you may select either an individual question or view data for all questions in the assessment (‘All Results’).
- For Knowledge Check questions, for ‘All Results’, you will see the percentage of overall correct answers. If you select a specific question (below), you see the distribution of response with the correct answer indicated in green.
- For Open Response questions, for ‘All Results’, you will see an overall percentage reflecting the total number of keywords present in participant responses / total number of keywords possible. If you select a specific question, (below), you’ll see the frequency a given keyword was used in that question.
- The Responses tab also contains a table of individual learner responses that can be searched, sorted, filtered and exported to support your specific needs.
-
-
Scoreboard Tab
- The Scoreboard tab contains a table ordered from highest to lowest based on a learners score. The table can be searched, sorted, filtered and exported to support your specific needs.
- The Scoreboard tab contains a table ordered from highest to lowest based on a learners score. The table can be searched, sorted, filtered and exported to support your specific needs.
-
Objectives Tab
-
As in the summary tab, Objectives provides an average value for each learning objective in the assessment. As a reminder, scores are calculated as a percentage of points earned / points possible.
-
Additionally, results for individual questions tagged with a given Objective are made available under Details. Choose the desired Learning Objectives from the drop-down menu. Hover over each question to see the full question title.
- The Responses tab also contains a table of individual learner responses that can be searched, sorted, filtered and exported to support your specific needs.
-
-
Filtering by Groups
-
In all tabs, results can be filtered by groups. The default group is All participants; to update, select the desired group from the drop-down list.
-